Desktop interface
The desktop app keeps projects and their work in the sidebar. The main area shows an issue, a thread, or one or more open workspaces. Start in the sidebar, open the item you care about, then select the execution or agent whose work you want to inspect.
Find a project, issue, or thread
Each project has a row in the left sidebar. Expand it to see its current issues and
threads, or select the project name to open the full issue list. Issues use a number
and title. Threads use a name such as docs or performance; see Threads
for when to create one.
An icon at the end of a row summarizes what needs attention. It can show an agent running, checks in progress, work ready for review, or a request for input, authorization, or approval. Hover over the icon for its label, then open the row to respond or inspect the latest activity.
Use the gear beside a project for that project's settings. The Workspace gear opens app-wide settings such as providers, GitHub, teams, and keybinds. The pages shown in settings change with the selected project, so use the gear beside the scope you intend to edit.
Issues and threads
An issue collects a bounded piece of work. Select the issue title at the top of a workspace to return to its overview. The overview contains:
- the description and labels;
- dependencies and child issues, when present;
- an execution list, with the agents and actions that ran in each execution; and
- a timeline of discussion and execution activity.
Select an execution row to inspect the whole run, or select an agent in the row to open that agent's workspace directly. Completed runs remain in the list, so the overview is the place to compare attempts or return to earlier work.
A thread opens on its ongoing discussion. Its tabs give you the thread chat, its tasks, and its current output such as the arc. Child issues appear in the thread's conversation and in the project sidebar as their own numbered work. Open a child issue when you need its description, execution history, branch changes, or pull request. Use the thread page to continue the larger discussion and the issue page to inspect a specific change.
Inspect an execution workspace
The tabs across the top of an issue workspace represent the agents and tasks in the selected execution. Select an agent name to make it active. The small controls beside that name open the views that exist for its work:
- Chat shows the transcript and the message box. Tool calls and their results are shown in place as the run progresses.
- Artifact shows the document the agent delivered, such as a plan or review. An approval control appears here when the run is waiting for you to confirm it.
- Diff shows changed files and their patches. Select a file row to inspect it in an adjacent pane.
- PR shows the pull request summary, changed-line totals, description, and the project checks reported for that pull request. Merge, close, and refresh controls appear in this view when available.
Only views that have content are shown. For example, a discussion-only agent has no diff tab, and project checks appear in the PR view rather than as a permanent tab on every workspace.
Work with more than one pane
Opening another issue keeps the current one available and can add a pane beside or below it. Opening a file or live tool from an agent workspace also uses an adjacent pane, so the transcript can remain visible while you inspect supporting work. Click a pane before using its tabs or keyboard controls. Drag the pane header to rearrange the layout, and close a pane or tab when you no longer need it.
Open a terminal, browser, or REPL
Select an agent, then use the + button at the right of its tab strip. The menu can create a task or open Terminal, REPL, Files, and Browser. These tools belong to that agent's workspace and open in their own pane.
Terminal
Use a terminal for shell commands, development servers, and interactive command-line programs. A new terminal opens ready for input; configured project commands can also appear in the + menu. The terminal stays available while its process runs. Its status bar shows command activity. Close the terminal when you are finished with the process.
Browser
Use a browser to inspect a website or exercise a web interface alongside the agent's transcript. Its toolbar has back, forward, reload, and an address field. The activity control opens the browser's observable page details, and the annotation control lets you mark elements for feedback. The browser tab remains available until it is closed; loading is shown in the reload control.
REPL
Use a REPL for short Python evaluations that should share variables and imports across several entries. The pane shows the interpreter, whether it is idle or running, and a transcript of code and results. Stop ends the interpreter but leaves that transcript readable. Resume starts a new generation with an empty namespace and continues the transcript. Remove discards the stopped REPL and its transcript.
Move quickly
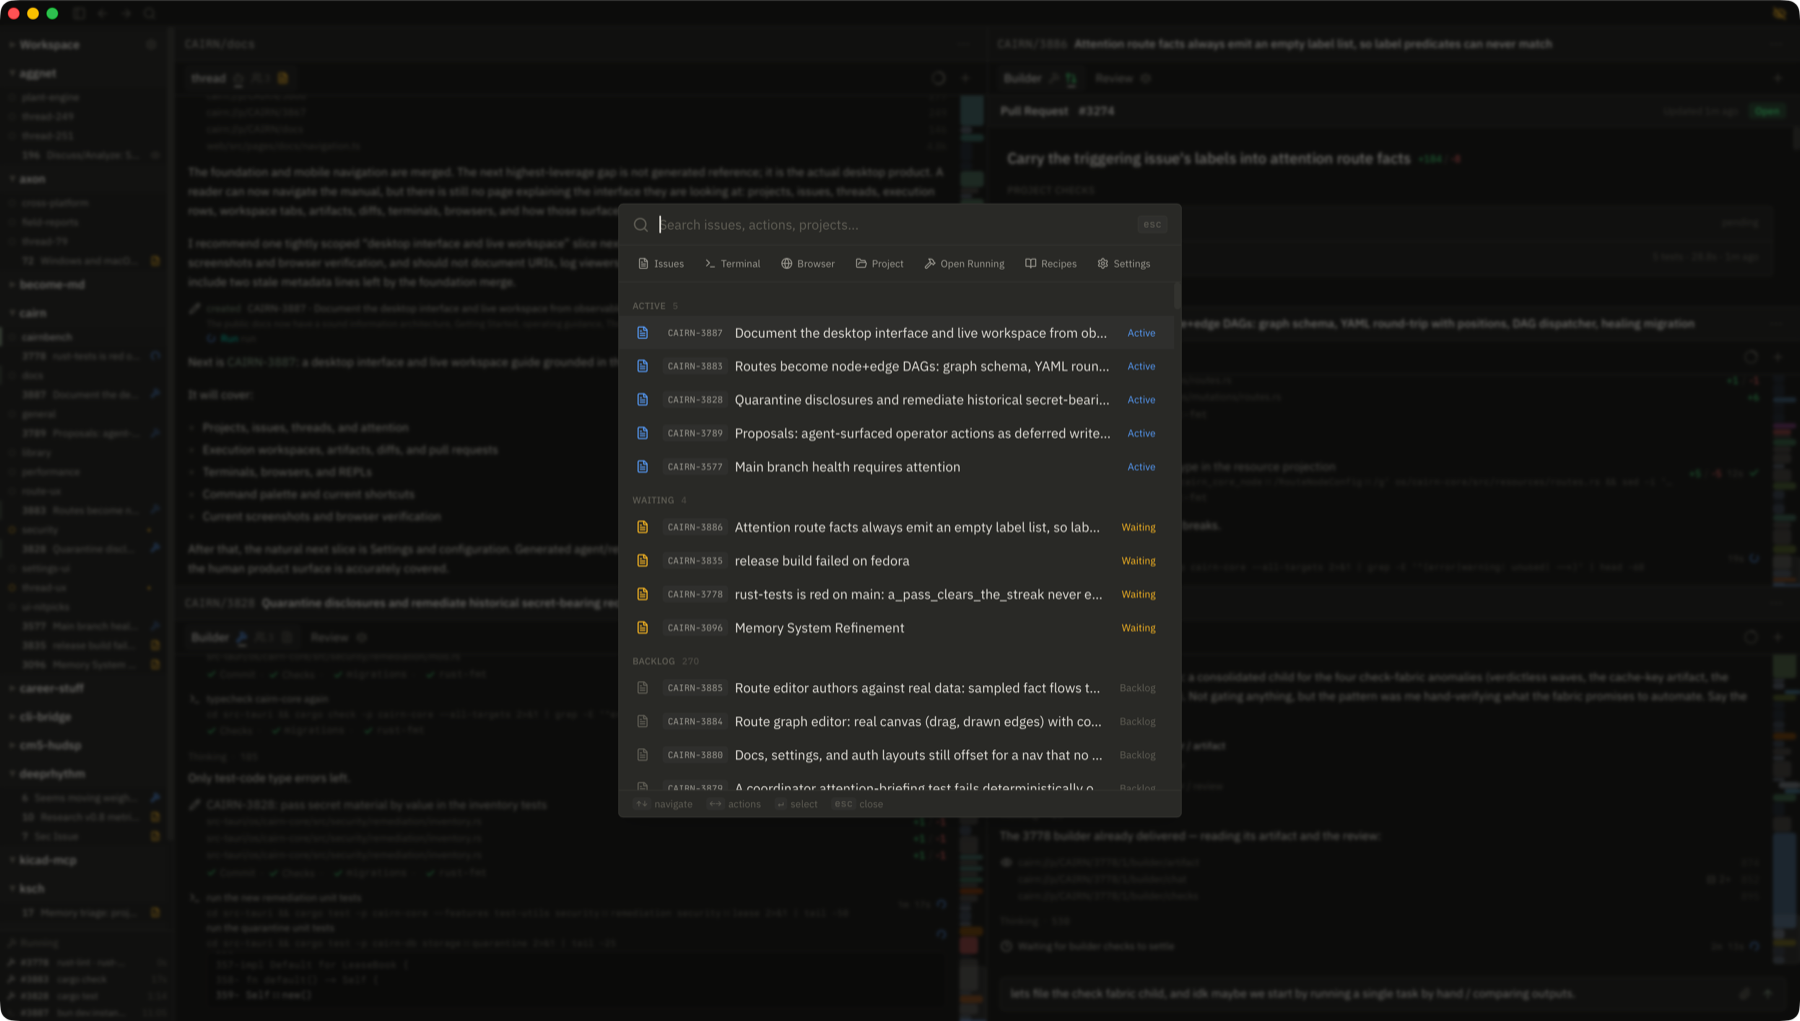
Select the search button in the title bar or press Command-K to open the command palette. It searches issues and their content, and its action row opens terminals, browsers, projects, running work, recipes, and settings. Results are grouped by status when no search text is entered. Use the arrow keys to select a result and Enter to open it.
Press ? outside a text field to open Keybinds help. The modal is generated from the app's current keybind registry and groups shortcuts by context, including the issue list, issue detail, selected agent, terminal, and chat. If you customize a shortcut under Workspace settings → Keybinds, the help modal shows the configured binding. Use that modal as the current shortcut reference rather than a copied list.